Image Credit: SUBMITTED/B.C. Assessment
January 02, 2019 - 11:27 AM
The most affordable place to live in the Thompson-Okanagan is Lytton while Sun Peaks has the priciest average home prices.
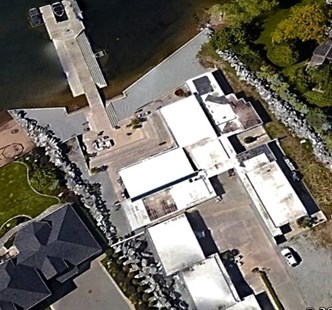
But the most expensive property of the region is at 4358 Hobson Rd. in Kelowna, which is valued at $10.6 million.
The top 39 most expensive properties are on the waterfront in the Central Okanagan with only a home at 12407 Coldstream Creek Rd. in Coldstream near Vernon breaking into the top 50 priciest homes at $6.2 million. And that’s still a waterfront property, on Kalamalka Lake.

This property on Hobson Road in Kelowna is valued at $10.6 million.
Image Credit: GOOGLE EARTH
That’s just some of the information now available from B.C. Assessment as it mails out almost 300,000 property assessment notices for 2019 to Thompson-Okanagan residents this week.
In most cases property values have gone up in the range of six to eight per cent, with the exception of Clearwater, where they stayed the same, according to B.C. Assessment.
The highest average residential properties are in Sun Peaks at $847,000, an increase of 18 per cent. That ties with Salmon Arm and Sicamous for the highest average increases in the region, although housing values are much lower in Salmon Arm ($364,000) and Sicamous ($293,800).
Lytton comes in at the most affordable at $137,500, a two per cent increase over 2017.
In what’s referred to by B.C. Assessment as the Okanagan, the most affordable location is Princeton at $198,000 (up seven per cent).
In the Central Okanagan, Kelowna is the most expensive city at $632,000 while Peachland is the least expensive at $582,500. Even so, that makes Peachland a more expensive place to live than anywhere else outside the Central Okanagan other that Coldstream, which has an average housing price of $590,000.
B.C. Assessment values houses as of July 1, 2018 so today’s actual value may be higher or lower, depending on market trends.
The assessed value of a home does not necessarily affect the taxes that need to be paid.
Each municipality collects a set amount of taxes and usually lists the amount owed by the owner of the average-priced house. If an individual property value rose by more than the average for that city, it will be subject to a tax increase that is greater than the average. Those properties that increased by less than the average will pay a lesser share.
Assessed values for individual properties can be viewed on the B.C. Assessment webpage here.
AVERAGE RESIDENTIAL VALUE
From B.C. Assessment
(Numbers in brackets are the percentage increase over 2017)
Thompson
Kamloops: $431,000 (8%)
Barrier: $221,500 (13%)
Cache Creek: $163,200 (10%)
Clearwater: $230,000 (0%)
Lytton: $137,500 (2%)
Merritt: $266,100 (9%)
Sun Peaks: $847,000 (18%)
South Okanagan
Keremeos: $270,200 (12%)
Oliver: $381,000 (8%)
Osoyoos: $414,000 (8%)
Penticton: $481,000 (8%)
Princeton: $198,000 (7%)
Summerland: $517,000 (10%)
Central Okanagan
Kelowna: $632,000 (7%)
Lake Country: $619,000 (7%)
Peachland: $582,500 (7%)
West Kelowna: $614,000 (6%)
North Okanagan
Armstrong: $384,000 (8%)
Coldstream: $590,000 (7%)
Enderby: $300,000 (2%)
Lumby: $323,400 (11%)
Salmon Arm: $364,000 (18%)
Sicamous: $293,800 (17%)
Spallumcheen: $364,000 (18%)
Vernon: $447.000 (8%)
To contact a reporter for this story, email Rob Munro or call 250-808-0143 or email the editor. You can also submit photos, videos or news tips to the newsroom and be entered to win a monthly prize draw.
We welcome your comments and opinions on our stories but play nice. We won't censor or delete comments unless they contain off-topic statements or links, unnecessary vulgarity, false facts, spam or obviously fake profiles. If you have any concerns about what you see in comments, email the editor in the link above.
News from © iNFOnews, 2019