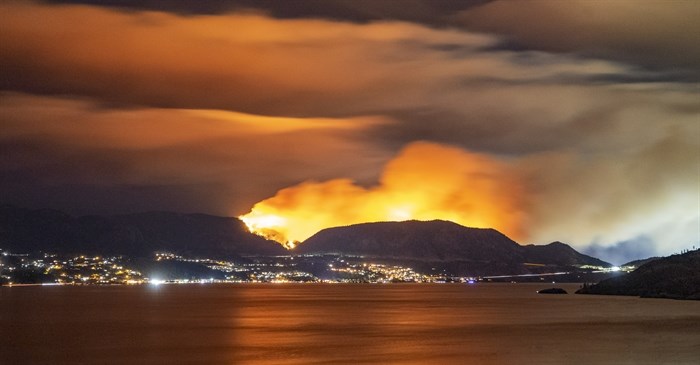
The Mt. Law wildfire near West Kelowna in 2021.
(DAN WALTON / iNFOnews.ca)
October 03, 2022 - 9:30 AM
Over a five-year period from 2017 to 2021, lightning caused 55% of the wildfires in B.C., but details about how the other 45% were sparked are pretty limited.
When iNFOnews.ca asked the B.C. Wildfire Service for the information, it responded with a pie chart that shows 10 other “causes” of wildfires. It lists 18% as unknown with 2% categorized as undetermined, meaning only 25% are assigned a particular cause. The largest group of non-lightening fires is Category 2 or 3 open burning followed by 5% for campfires.
Even the total number of wildfires in B.C. is nearly impossible to find since the format for each annual report does not necessarily include the number or causes of the fires.
If you want to find out the causes of wildfires in Alberta, you can access and view a spreadsheet online that shows there were 19,844 fires from 2006 to 2018.
READ MORE: Kamloops Fire Centre sees record-breaking number of hectares burned this year
In the Alberta data base there are not only the thousands of fires listed but there are also 35 columns of specific information. Those columns range from size of fires to longitude and latitude to whether it was on flat or hilly terrain. All the relevant start and end dates and times are included along with basic weather conditions.
When it comes to causes, there are numerous columns of information.
Just as an example, on April 28, 2006, a 0.01 hectare fire started at 9 p.m. and was discovered at 11:45 p.m. It was on private land. The general cause is listed as recreation, the responsible group was campers, the activity was cooking and the true cause was listed as abandoned fire.
The list goes on and on and on.
Along with campers, there were fires caused by hikers, boat/canoe/kayak, mechanized travel, ATV users, grudges and many more.
In B.C., 3% of wildfires were caused by vehicles, another 3% are listed as arson or suspicious and 3% for electrical/other infrastructure. Equipment use came in at 2% and railroads 1%. The 2% that are listed as miscellaneous are for causes such as firearm use, fireworks, flares, blasting, grinding, cutting, welding and many more.
The scarcity of information from the wildfire service is in the process of being changed.
“We are currently in the middle of a bigger project to revamp how we display our fire information and statistics,” Briana Hill, wildfire service fire information officer, said in an email to iNFOnews.ca. “Thank you for sending the Alberta link. Always interesting to see how other jurisdictions are putting this information together.”
There was no indication as to what changes B.C. might be making or when.
The Alberta data base can be viewed here.
To contact a reporter for this story, email Rob Munro or call 250-808-0143 or email the editor. You can also submit photos, videos or news tips to the newsroom and be entered to win a monthly prize draw.
We welcome your comments and opinions on our stories but play nice. We won't censor or delete comments unless they contain off-topic statements or links, unnecessary vulgarity, false facts, spam or obviously fake profiles. If you have any concerns about what you see in comments, email the editor in the link above.
News from © iNFOnews, 2022