
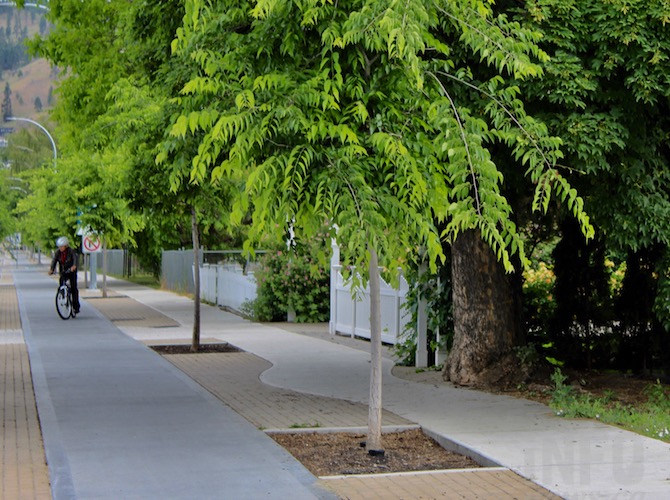
Kelowna among the most cycle friendly cities in B.C.
A new interactive tool shows Kelowna has more bicycle paths per kilometre of roadway than any other B.C. city.
It’s one of the measures that used to show how cycle-friendly communities are in B.C.
The Cycling Infrastructure in B.C. tool, released Oct. 6, shows that Kelowna has 149 metres of cycling infrastructure for each of its 1,626 km of roads.
Surrey is second on that list at 123.2 metres for each of its 4,375 km of road.
Other cities in the Thompson-Okanagan region fall well short.
Kamloops has 34 metres per each of its 1,755 km of roadways. Penticton fares better at 50.7 metres over its 449.4 km of roadways.
Far behind are Vernon at 7.1 metres (564 km of roads) and West Kelowna at 3.9 metres (846 km of roads).
The tool also shows total kilometres of cycling infrastructure, broken down by comfort levels.
Surrey has the most bike infrastructure of any city at 539.1 km. But, given its size (324 square km) and amount of roadways, that’s understandable.
Vancouver is second with 340.8 km while Kelowna (260 square km) comes in third at 242.3.
Again, the rest of the Thompson-Okanagan falls way behind.
Kamloops has 59.7 km of bike infrastructure, Penticton 22.7 km, Vernon 4 km and West Kelowna is listed at 3.3 km.
The tool breaks down the kind of infrastructure cities provide into three “comfort” classes.
High comfort includes cycle tracks (lanes physically separated from roadways), bike-only pathways and local street bikeways (usually residential streets), of which Kelowna has 25.7 km.
Medium comfort are multi-use paths. Kelowna has 46.3 km of those.
Low comfort refers to painted bike lanes, which make up that vast majority (170.3 km) of Kelowna’s cycling infrastructure.
READ MORE: Driverless bus could become part of the Rail Trail in Kelowna
Another measure is bicycle infrastructure per person. Whistler ranks at the top with 3.9 metres per person.
Kelowna is 10th on that list at 1.9 metres per person.
Kamloops and Penticton come in at 0.7 metres per person while Vernon and West Kelowna are down at 0.1 metres per person.
The Cycling Infrastructure tool was developed by Simon Fraser University’s Cities, Health and Active Transportation Research Lab, led by Faculty of Health Sciences professor Meghan Winters.
It’s part of a nation-wide project on bicycle pathways that has to wrestle with different definitions used by different communities.
“We built this tool with the aim to address data gaps we were hearing about from municipal staff and advocates, especially in smaller communities,” Winters said in a news release.
It was built using OpenStreetMap and applied the Canadian Bikeway Comfort and Safety classification, “which acknowledges that certain types of routes are safer, and preferred by more people,” the release says.
The tool can be accessed here.
To contact a reporter for this story, email Rob Munro or call 250-808-0143 or email the editor. You can also submit photos, videos or news tips to the newsroom and be entered to win a monthly prize draw.
We welcome your comments and opinions on our stories but play nice. We won't censor or delete comments unless they contain off-topic statements or links, unnecessary vulgarity, false facts, spam or obviously fake profiles. If you have any concerns about what you see in comments, email the editor in the link above.