
Putting 'slumping' Kamloops, Okanagan real estate prices into perspective
While housing prices are down from their peak in the spring, it’s all relative.
Real estate markets fluctuate over time and the Canadian market was particularly impacted by COVID where sales and prices, initially, dropped dramatically.
The market quickly recovered and really took off about a year ago with a buying frenzy that led to bidding wars and homes selling for well over their asking price.
With rising interest rates, the number of sales is dropping and there is some moderating impact on prices.
But that may not last long.
“We’re not convinced a sales uptick last month in Vancouver marked a turning point but it could signal a slowing in the pace of correction,” a Nov. 7 RBC Special Housing Report says. “Declining price trends appear to be broadly moderating with all major markets reporting smaller rates of depreciation in October.”
In the Central Okanagan, for example, the benchmark (typical) selling price of single-family houses peaked in March at $1,131,800.
It has now dropped to $997,000. That’s a significant (almost $135,000) decline.
But, even at the lower value in October, these prices are up by about $274,500 from the $722,463 benchmark selling price for a single-family home before the pandemic in March of 2019.
The benchmark prices for single-family homes were up slightly (1.5%) in October versus September in the Central Okanagan and up 6.9% in Kamloops.
There are a number of different ways of measuring housing prices from average and median to benchmark and something called a home price index.
“Given that the average sale price is vulnerable to shifts in the composition of sales, the home price index adjusts for this by estimating the price of a fixed ‘composite’ unit across time,” states an explanation by the B.C. Real Estate Association that accompanies a graph of prices from Jan. 1, 2019 to Sept. 1, 2022. “This removes composition biases and provides a smoother estimate of the price in a region across time.”
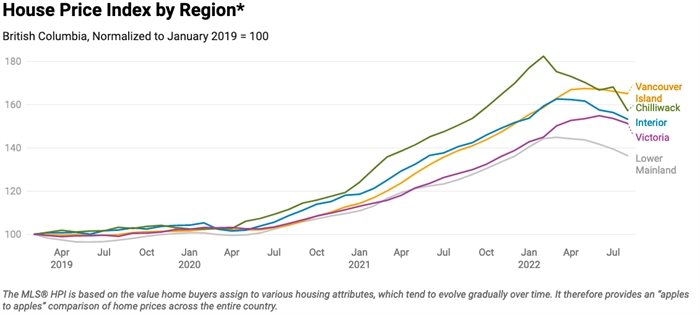
The chart pegs all homes at 100 on Jan. 1, 2019 and shows the rise in prices up to Aug. 1, 2022 relative to that base.
The Interior is the blue line that peaks in March at 162.66 and only fell to 153.32 by Aug. 1.
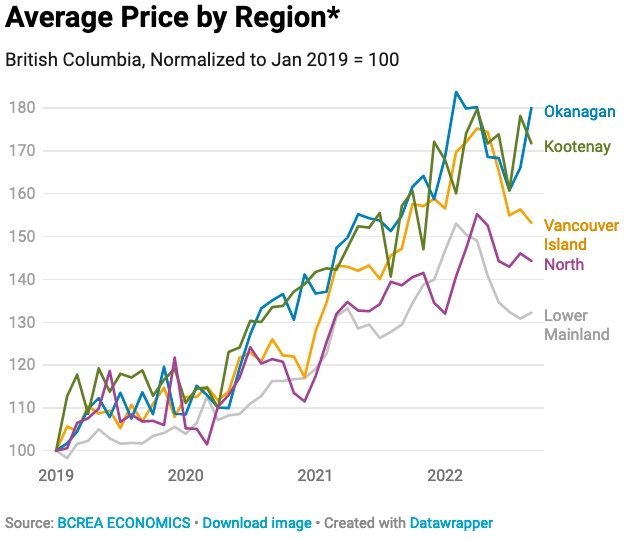
Another graph shows the average price of homes sold with Jan. 1, 2019 being rated at 100. Again, the Interior is in blue.
At no time since 2019 has the index dropped below 100. It peaked at 183.74 in February and only dropped to 180.0 by Sept. 1
The B.C. Real Estate Association also tracks the number of sales in each region
The Interior is in blue on the graph, which show sales plummeted to 47.81 from the base of 100 as of April 1, 2020.
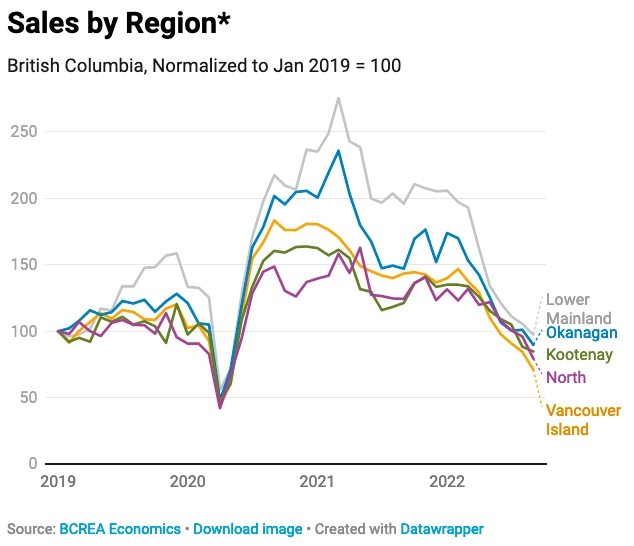
That precipitous drop-off in sales volume only lasted a couple of months at the height of COVID. Sales spiked at 235.7 points as of March 1, 2021. It took until Sept. 1, 2022 for sales to drop, again, below the base, reaching 89.77.
The graphs are interactive on the B.C. Real Estate Website, here.
Canada Mortgage and Housing Corporation has a graph showing prices in the country as a whole from 2005 until this year.
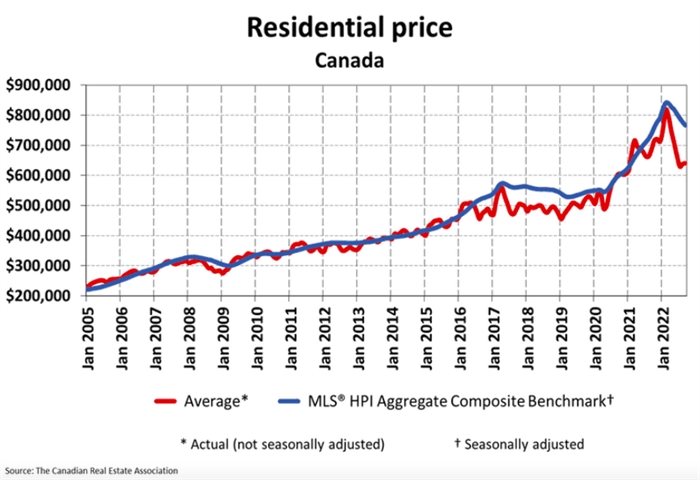
It shows an average price of just over $200,000 for all homes in 2005. It’s risen to about $775,000 this year.
The biggest factor impacting housing sales this fall has been the steadily rising Bank of Canada key lending rate. It’s gone up to 3.75% from 0.25% at the start of the year.
Statistics Canada has a webpage, here, that goes back, by month, all the way to 1951.
It shows a five-year conventional mortgage in September of this year was at 5.64%. That’s only slightly higher than the 5.5% in May 1951.
Mortgage rates climbed slowly but fairly steadily until 1951 until they hit double digits (10.11%) for the first time in September 1969.
They peaked at 21.46% in September 1981.
Still, the current mortgage rate of 5.64% is the highest it has been since January 2009 when it reached 5.78%.
More recently, mortgage rates were down to 3.2% in the summer of 2021.
For each 1% increase in mortgage rates, the cost of monthly payments goes up by about $45.
READ MORE: Real estate prices drop for condos but rise for houses in Okanagan, Kamloops
To contact a reporter for this story, email Rob Munro or call 250-808-0143 or email the editor. You can also submit photos, videos or news tips to the newsroom and be entered to win a monthly prize draw.
We welcome your comments and opinions on our stories but play nice. We won't censor or delete comments unless they contain off-topic statements or links, unnecessary vulgarity, false facts, spam or obviously fake profiles. If you have any concerns about what you see in comments, email the editor in the link above.